
Troubleshooting
Use this page to diagnose common issues with data collection and metric discrepancies between Contentsquare and other analytics tools.
My data is not being sent
Section titled My data is not being sentUsing the Chrome extension Contentsquare Tracking Setup Assistant ↗, use the checklist below.
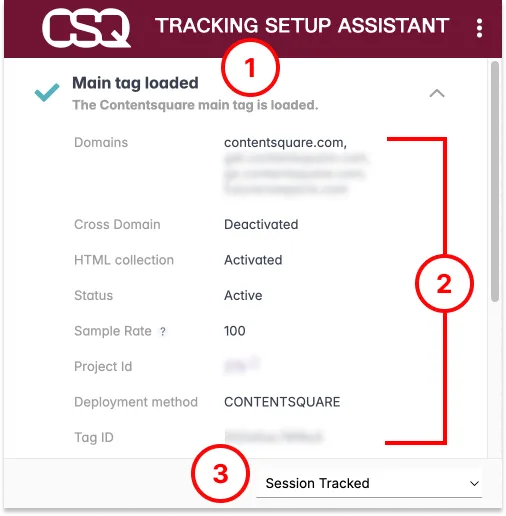
- Is the main tag loaded? (Marker "1" above). If not:
- Make sure the call is done by your Tag Management System or in your template.
- Make sure that no Cross-origin Resource Sharing (CORS) rules is preventing the call to be made.
- Is the tag active? (Marker "2" above, the "Status" should be "active". — Otherwise, contact us)
- Is the domain authorized? (The current domain should be listed here, on marker "2" above — Otherwise, contact us.)
- Is the current session tracked? (Marker "3" — Otherwise, update this dropdown menu.)
My CS metric is different from other Analytics tool
Section titled My CS metric is different from other Analytics toolThe current web analysis technology is dependent on different browsers, operating systems and screen resolution. These different components can affect the quality of the data of all analytical tools.
When you compare Contentsquare data with other analytical tools, you can see differences between major metrics. There are several factors to consider depending on the tool and the indicators you are comparing.
Other analysis definitions. — The following measurement definitions have been extracted from the official Adobe Analytics and Google Analytics documentation. For additional troubleshooting assistance, refer to the corresponding tabs.
Sessions vs Visits metrics
Section titled Sessions vs Visits metricsDefinitions
Section titled DefinitionsContentsquare
Section titled ContentsquareThe number of unique visits that happened within the selected analysis context.
A visit ends after 30 minutes of inactivity.
Google Analytics
Section titled Google AnalyticsTotal number of Sessions (not unique) within the date range.
A session is the period of time a user is actively engaged with your website, app, etc.
All usage data (Screen Views, Events, Ecommerce, etc.) is associated with a session.
Adobe Analytics
Section titled Adobe AnalyticsA sequence of page views in a sitting. The visits metric is commonly used in reports that display the number of user sessions within the selected time period.
The visit metric is always associated with a time period, so you know whether to count a new visit if the same visitor returns to your site. A session starts when the user first arrives on your site, and ends under one of the following scenarios:
- 30 minutes of inactivity: Almost all sessions end in this manner. If more than 30 minutes have elapsed between image requests, a new visit begins.
- 12 hours of consistent activity: If a user fires images requests without a 30+ minute gap for 12 hours, a new visit automatically starts.
- 2500 hits: If a user generates many hits without starting a new session, a new visit is counted after 2500 image requests.
- 100 hits in 100 seconds: If a visit consists of more than 100 hits that occur in fewer than 100 seconds, the visit automatically ends. This behavior typically indicates bot activity, and this limitation is enforced to prevent these processing-intensive visits from increasing latency and increasing the time it takes to generate reports.
A visit does not necessarily coincide with a browser session.
Troubleshooting suggestions
Section titled Troubleshooting suggestionsA major discrepancy in the visits/sessions can be due to multiple factors:
- Different metric definition, as per the information shared above
- The Tag firing method, which might come in place too late, hence allowing the users to bounce before tracking their visit.
- The trigger chosen might not be the same used for your other analytics tool, hence creating a major difference.
Bounce and Bounce rate metrics
Section titled Bounce and Bounce rate metricsDefinitions
Section titled DefinitionsContentsquare
Section titled ContentsquareThe ratio between the visitors who entered the site and left it without having seen a second page and all visitors, regardless of the amount of actions taken on that single page.
Google Analytics
Section titled Google AnalyticsA bounce is a single-page session on your site. Bounce rate is single-page sessions divided by all sessions, or the percentage of all sessions on your site in which users viewed only a single page and triggered only a single request to the Analytics server. These single-page sessions have a session duration of 0 seconds since there are no subsequent hits after the first one that would let Analytics calculate the length of the session.
Adobe Analytics
Section titled Adobe AnalyticsBounces
A visit that consists of a single server call.
For example, a single page visit is a bounce if a visitor does not interact with the page in a way that sends data to Adobe, such as clicking a link or a video start.
Bounce Rate
Shows the percentage of visits that contain a single hit.
Bounce rate uses the Bounces metric and is calculated as: Bounces divided by Entries.
Bounce Rate does not include visits where multiple actions occurred on a single page.
Troubleshooting suggestion
Section titled Troubleshooting suggestionWhen facing a major discrepancy with bounce and bounce rate, the Contentsquare definition of bounce rate takes into account visitors who viewed only a single page, regardless of the amount of events/actions they took.
Pageviews metrics
Section titled Pageviews metricsDefinitions
Section titled DefinitionsContentsquare
Section titled ContentsquareTotal number of pages viewed.
This takes into account all the artificial pageviews triggered by the trackpageview function.
Google Analytics
Section titled Google AnalyticsPageviews is the total number of pages viewed.
Repeated views of a single page are counted.
Adobe Analytics
Section titled Adobe AnalyticsA Page View is counted for each server call that is sent.
This metric represents total instances of Page View.
TrackLink calls are not counted as page views and do not increment the Page Views metric.
Troubleshooting suggestions
Section titled Troubleshooting suggestionsA major discrepancy in the pageviews count can be due to multiple factors, such as:
- The events that you're tracking with your other analytics tool might not be accounted for as Pageview.
- If most of your site is running on a SPA framework, Contentsquare tracks each re-routing as a new pageview.
Transactions vs Conversions metrics
Section titled Transactions vs Conversions metricsDefinitions
Section titled DefinitionsContentsquare
Section titled ContentsquareThe number of sessions during which visitors completed an Ecommerce transaction.
An E-commerce transaction is defined by firing the Contentsquare E-commerce tag.
Google Analytics
Section titled Google AnalyticsTransactions is the total number of completed purchases on your site.
Adobe Analytics
Section titled Adobe AnalyticsConversions
Custom Conversion reports are based on eVars (conversion variables). Conversion variables can persist beyond the page view and be associated with metrics within its specified expiration. The reports' default metrics are revenue.
All standard eCommerce metrics can be used: Revenue, Orders, Units, Carts, Cart Views, Checkouts, Cart Additions, Cart Removals.
For further reference: https://experienceleague.adobe.com/docs/analytics/technotes/ga-to-aa/reports/conversions-reports.html?lang=en ↗
Orders
The number of orders made on your website during the selected time period.
Troubleshooting suggestions
Section titled Troubleshooting suggestionsWhen facing major discrepancies with the transactions count, if you have different confirmation pages, make sure to fire our ecommerce tag on all of them.
Conversion rate
Section titled Conversion rateDefinitions
Section titled DefinitionsContentsquare
Section titled ContentsquareThe number of sessions with Ecommerce transactions divided by the total number of sessions throughout the selected period.
Google Analytics
Section titled Google AnalyticsThe percentage of sessions that resulted in an e-commerce transaction.
Adobe Analytics
Section titled Adobe AnalyticsSee the conversions point above.
Troubleshooting suggestions
Section titled Troubleshooting suggestionsWhen comparing conversion rate between different tools, do the Contentsquare conversion rate is based on the ratio between the number of visits with a transaction and the total number of visits.
This definition might differ depending on the other analytics tool you're using.
Revenue metrics
Section titled Revenue metricsDefinitions
Section titled DefinitionsContentsquare
Section titled ContentsquareTotal purchase amount of all sessions.
Google Analytics
Section titled Google AnalyticsThe total revenue from web ecommerce or in-app transactions.
Depending on your implementation, this can include tax and shipping.
Adobe Analytics
Section titled Adobe AnalyticsRevenue is captured on the purchase event, and is defined as the total dollar amount for the sum of the order for each product.
This value comes from the purchase event.
Troubleshooting suggestions
Section titled Troubleshooting suggestionsA major discrepancy in the revenue can be due to multiple factors:
- Contentsquare only takes into account the amount set as 'revenue' in the e-commerce tag when calculating the total revenue displayed
- If you need to exclude shipping and taxes from the total revenue, you would need to do so before sending the transaction.
- If you have a returns policy, do Contentsquare does not support negative values in the transactions, so this won't be tracked.