Error Analysis
Error Analysis enables you to quantify, prioritize, and visualize errors occurring on your site. This section covers all the information you need to enable proper error collection within Contentsquare.
JavaScript errors
Section titled JavaScript errorsWhen displaying JavaScript errors in the Error Analysis module, the top error might be "Script error".
Contentsquare collects errors via web browser, however the majority of browsers don't share the details of an error coming from another domain (function name, file) unless they are allowed to.
That's why, for some errors, Contentsquare can only report "Script Error", as it is a setting coming from the browser and the hosting server.
Scripts to unmask
Section titled Scripts to unmaskStart by mapping out JavaScript errors that your team struggle to reproduce and fix.
Create a spreadsheet to list your third-party party providers and keep track of which scripts have been unmasked with the crossorigin ↗ attribute.
Bear in mind that some third-parties such as Google, Meta, or Adobe can't be unmasked.
Unmasking script errors
Section titled Unmasking script errors-
Add
Add Access-Control-Allow-OriginHTTP header on the script and a wildcard (*).Access-Control-Allow-Origin: * -
Add
crossorigin=anonymouson the script tag:<script src="http://another-domain.com/app.js" crossorigin="anonymous"></script>This instructs the browser to fetch the file anonymously so that no sensitive data is forwarded via cookie or HTTP authentication.
Unmasking script errors locally
Section titled Unmasking script errors locallyEven though Contentsquare can't access any specific details about local errors, you can try to reproduce the error to know more which errors to unmask first.
-
Open your website on a page that consistently produces errors.
-
Open the browser console to view a full unmasked log of errors on this page.
-
Enter the following code to check what the Tag has access to when this error occurs:
window.onerror = function (errorName, file, lineNo, colNo, errStack) {debugger;};
Masking script errors permanently
Section titled Masking script errors permanently-
Choose the scripts to unmask
The more scripts you unmask, the more errors you can collect. Start by prioritizing the scripts to unmask:
- Ask among the website developers team
- Select scripts from the Error Analysis module: some "Script Errors" point to a specific file
- Ask third-party providers to do the same: their JavaScript libraries will be added to your watch list.
-
Add a cross-origin HTTP header on the server for these scripts:
Access-Control-Allow-Origin: * -
Add a
crossorigin="anonymous"attribute on these scripts:<script src="http://another-domain.com/app.js" crossorigin="anonymous"></script>
After 3 hours, the script errors should start being replaced by the actual details of the scripts in Error Analysis.
API Errors
Section titled API ErrorsAPI error collection helps you monitor site performance and user experience over time. You have the ability to collect additional information surrounding API Errors, about your analysis needs.
Mask API errors URLs
Section titled Mask API errors URLsTo ensure safe error collection, you may need to configure for Personal Data to be masked. See Removing Personal Data in API errors.
Advanced troubleshooting
Section titled Advanced troubleshootingAPI Errors Advanced Troubleshooting configuration enables you to create rules to collect more information about API errors (headers, request/response body content), and collect API errors with a status code, not only in the 4XX-5XX range, so you can troubleshoot errors faster.
Use API Errors Advanced Troubleshooting to:
- Setup collection of API errors for network requests where the HTTP status code is below 400.
- See the following types of additional API error details in the Event Stream of Session Replay:
- The HTTP headers of the request and the response
- The body (the data sent by the request or received in the response)
- The body elements (specific elements of the request/response body)
- The query parameters of the request endpoint (of the URL of the information you request for).
- Leverage unencrypted response body elements in Errors Dashboard & Alerts and Analysis Context to monitor, identify and quantify errors based on response body content.
For more information, see Configuring API Error Collection Rules ↗
Why CSP errors can reference uxa.js
Section titled Why CSP errors can reference uxa.jsWhen API Errors tracking or Network Details is turned on for a project, the Tag patches browser network APIs (fetch and XMLHttpRequest) to collect request metadata.
Because network requests made via these patched APIs pass through the Tag wrappers, uxa.js can appear in the call stack for requests started by other scripts that call fetch or XMLHttpRequest.
If a request initiated via fetch or XMLHttpRequest is blocked by Content Security Policy (CSP), browser console logs can reference uxa.js in the stack. This does not mean the Tag is the origin of the blocked request.
To identify the source of the CSP issue, inspect the blocked URL, the CSP directive, and the request initiator chain in browser DevTools.
Custom errors
Section titled Custom errorsWith the Custom Errors feature, collect any text displayed on the user screen because of a specific action such as:
- Filling a form,
- Loading a product list,
- Log in to a website,
- A request failing to get the remaining stock quantity on a product page.
Custom errors can be located inside alert banners, pop-up windows, or inline in a form.
Sending custom errors
Section titled Sending custom errorsYou can send a maximum of 20 custom errors per page.
To collect custom error messages, use the trackError command:
<script type="text/javascript"> window._uxa = window._uxa || []; window._uxa.push([ "trackError", "<MESSAGE>", {key: value, key: value, ...} ])</script>where:
<MESSAGE>is astringwhich contains the text displayed to end-users (max. 300 characters).- (optional) - A JavaScript object with up to 5 key/value pairs to categorize the errors.
Both the key and value should be
stringand can be up to 30 characters.
Examples
Send a custom error for a failing request, typed as an error from the system:
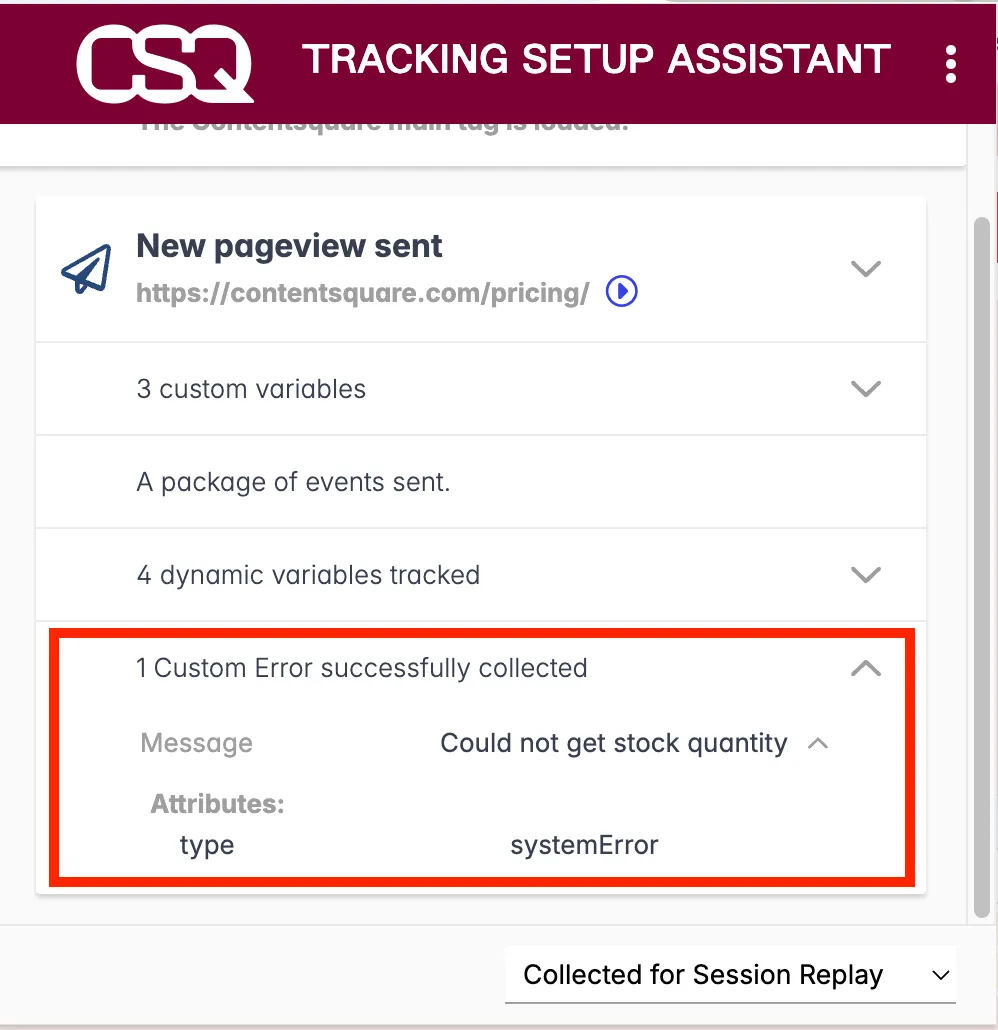
<script type="text/javascript"> window._uxa = window._uxa || []; window._uxa.push(["trackError", "Could not get stock quantity", { type: "systemError" }]);</script>Send a custom error for incorrect user input with multiple attributes (type, severity, language):
<script type="text/javascript"> window._uxa = window._uxa || []; window._uxa.push([ "trackError", "140000 is not a valid postal code", { type: "formValidation", severity: "minor", lang: "english" }, ]);</script>Verifying the sending of custom errors
Section titled Verifying the sending of custom errorsUse the Contentsquare Tracking Setup Assistant Chrome Extension ↗ to track custom errors that are sent.

Errors collection in Contentsquare Console
Section titled Errors collection in Contentsquare ConsoleInformation retrieved from console messages can help developers understand what is happening behind the scenes, debug issues, and catch exceptions that don't usually block script execution.
Console messages collection
Section titled Console messages collectionAs a project administrator or Contentsquare implementation manager, configure the console messages collection:
- Log into https://console.contentsquare.com/ ↗.
- Within your project, navigate to
Advanced errors troubleshooting>Console messages, and selectAdd log levels. - Select the levels and click
Apply.
It takes about one hour to see the analysis for console messages in the Error Analysis module.

