Error analysis
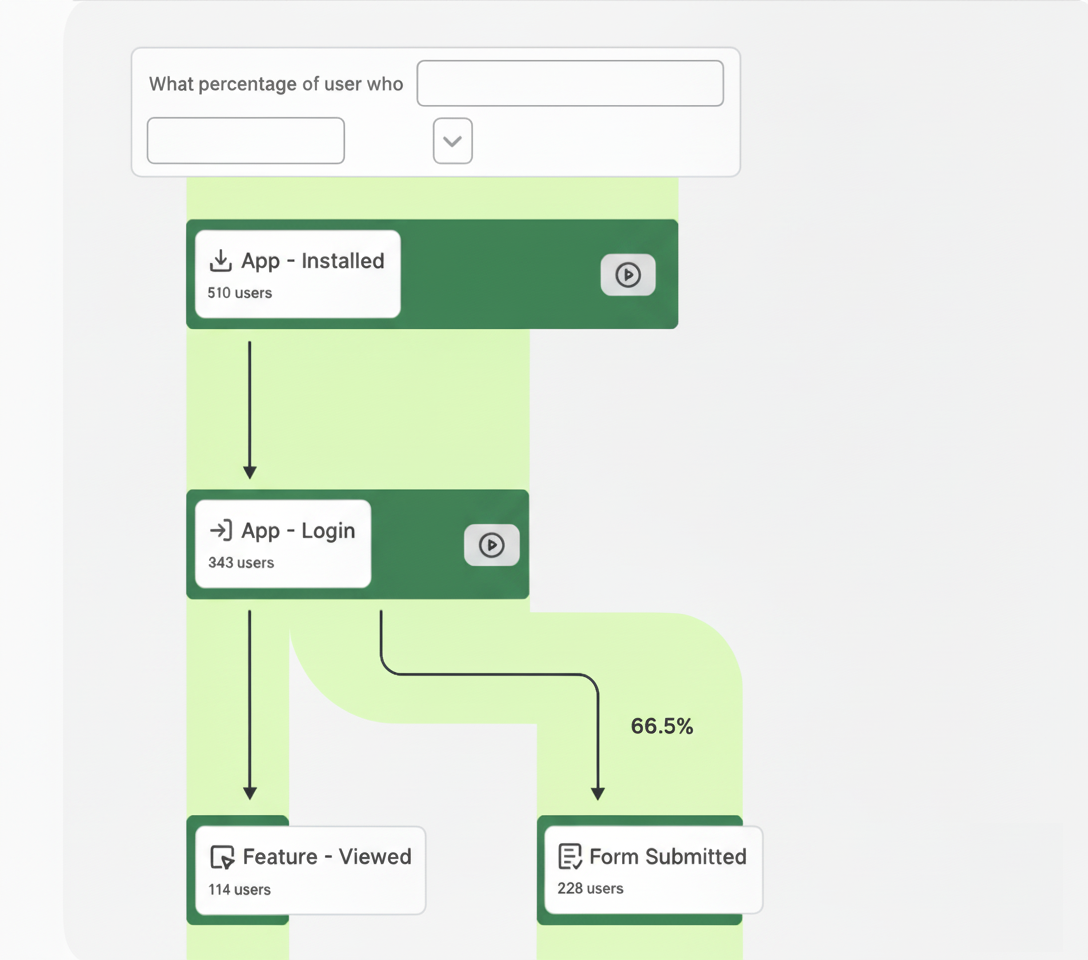
Error Analysis automatically captures API errors and network failures in your Capacitor app and surfaces them in the Contentsquare platform.
Get Started
Section titled Get StartedStart the SDK
Section titled Start the SDKYou do not need to do anything to start the errors collection, it will start itself with Contentsquare SDK.
Sample App
Section titled Sample AppFor best implementation practices of our library, explore the Contentsquare for Capacitor sample app ↗.
JS Errors
Section titled JS ErrorsSimilar to web context, JS errors are collected out of the box if the collection is enabled in the web project associated to the Capacitor project.
Find more information on how Contentsquare handles JS errors in our JavaScript errors Help Center article ↗.
API Errors
Section titled API ErrorsAutomatic network inspection
Section titled Automatic network inspectionAPI Errors automatically collects failed network requests.
Debugging and Logging
Section titled Debugging and LoggingIf in-app features are enabled, a info log should appear with the details of the event (see Capacitor Debugging and Logging section):
CSLIB ℹ️ Info: API Error (from Webview) - GET 401 https://api.client.comHow API Errors works
Section titled How API Errors worksInitialization
Section titled InitializationThe way our SDK works is by auto-starting with the application launch and automatically collects failed network requests.
Configuration
Section titled ConfigurationOnce started, our SDK fetches its config from our servers. It will start collecting data from network events if the API Errors setting is enabled in the config (this is handled by the Contentsquare team).
Tracking
Section titled TrackingThe SDK monitors only the API Errors with response code above 400, and generates analytics data. These events are then locally stored, and eventually sent to our servers in batches.
Sending data
Section titled Sending dataFor each network error, a new event will be sent in analytics and Session Replay data.
API Troubleshooting Details
Section titled API Troubleshooting DetailsAPI Errors troubleshooting details enables you to collect more information about API errors so you can troubleshoot errors faster.
With this feature you will be able to see three types of additional API error details in the Event Stream of Session Replay.
- The HTTP headers of the request and the response.
- The body (the data sent by the request or received in the response).
- The query parameters of the request endpoint (of the URL of the information you request for).
See API Troubleshooting Details ↗ for more details.
Collected data points
Section titled Collected data pointsOnly network calls in error (response code above 400) will be collected. Here the exhaustive list of data collected:
- URL (without query strings)
- HTTP method
- Response code
- Timestamp of the request
- Timestamp of the response
- HTTP headers of the request
- HTTP headers of the response
- HTTP body of the request
- HTTP body of the response
- Query parameters of the request endpoint
Known limitations and recommendations
Section titled Known limitations and recommendationsConflict with Firebase Performance Monitoring
Section titled Conflict with Firebase Performance MonitoringContentsquare Error Analysis is not compatible with Firebase Performance Monitoring auto-collection. Only one of the two will log events, and usually, the events will be automatically logged by the Contentsquare Error Analysis. To log events to Firebase Performance Monitoring, we suggest logging it manually ↗.
Contentsquare Error Analysis is compatible with Firebase Performance auto-collection, but the HTTP body from the response won't be collected by the Error Analysis SDK. Contentsquare Error Analysis may not be compatible with other network auto-collection tools.

